
Feature Overview: Changing Your View Between Trade, Areas, and Stages
BuildPartner gives you three different views of the same project, allowing you to analyse costs through the lens of Trade, Stage, and Area. Reviewing the information from each perspective helps you understand how the budget is being allocated, identify imbalances, and have more informed conversations with your client about where their money is being spent. This article shows you how to switch between the different views at your disposal.
How To Access the Different Views
When you log in to BuildPartner, head to the Schedule page. Towards the top centre of the page, you’ll see three options:
- Trade: a breakdown of project costs by individual trade.
- Stages: a breakdown of the project by stages of work.
- Areas: a breakdown of the project by rooms or property areas.
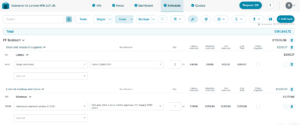
When you first open the Schedule page, the default view is Areas. However, each view gives you a different way of reviewing your project, so it’s worth becoming comfortable with all three.
Having more than one way to analyse your project output gives you a clearer picture of how effectively your client’s budget is being allocated.
By reviewing the costs by Trade, Stage, and Area, you can spot imbalances and make informed decisions about where changes may be needed to meet your client’s priorities and expectations.
For example, after reviewing Areas, your client may decide that the £11k spent on an en-suite is better spent on upgrading the kitchen or another area that is more important to them.
It’s worth noting that the totals across all three views will always match exactly. So, if you make a change in one view, whether by adding, deleting, or amending a task, the change will automatically be reflected across all three views.
To toggle between detailed and headline costs, click the square icon next to the “Buildups” button.
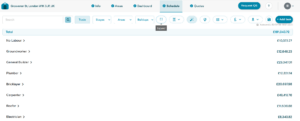
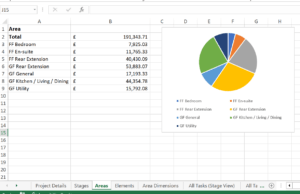
You can also export these views to Excel or Google Docs if you wish to analyse the data further. For example, you can create charts, graphs, or percentage breakdowns to show how costs are distributed. Simply click the down-arrow button in the top-right corner, next to Save, and select Excel.
We’re always improving BuildPartner to make your project information more accessible and easier to read, helping you analyse costs and make more informed decisions. Let us know how you’re finding the features or what you’d like to see next by emailing us at [email protected]